Manual
Synopsis and options
For further questions and updates, please contact ductape-users@googlegroups.com or subscribe to the user group
Requirements
DuctApe should work in all Unix systems with a python install; the dependencies are the following:
- python 2.6 or higher (now compatible with python 3)
- Biopython
- NumPy
- SciPy
- matplotlib
- scikits.learn
- multiprocessing (included since python 2.6)
- networkx
- PyYaml
- Blast+
Each one of this dependencies can be installed directly, through the pip package manager or through your operating system package manager (i.e. apt-get for Debian/Ubuntu, yum for Fedora, ecc..). The only exception is Blast+, which is a stand-alone application.
Example of a python library install through pip (using the command line)
sudo pip install matplotlib
If you are working in a Debian-based Linux distribution (like Ubuntu), you can install all the dependencies with the following command
sudo apt-get install python-numpy python-scipy python-sklearn python-matplotlib python-biopython python-networkx python3-networkx python3-numpy python3-scipy python3-matplotlib ncbi-blast+
If you prefer anaconda, make sure you have bioconda listed as a channel, and you can install all the dependencies with the following command
conda create -n ductape pip numpy scipy scikit-learn matplotlib biopython networkx blast
Installation
There are multiple ways to install DuctApe:
Method 1 (requires anaconda; all dependencies will be installed)
conda create -n ductape pip numpy scipy scikit-learn matplotlib biopython networkx blastconda activate ductape(orsource activate ductape)python -m pip install DuctApe
Method 2 (missing dependencies will be downloaded)
sudo pip install DuctApe
Method 3 (dependencies won't be checked)
- Extract the archive
- Enter the directory
- Install
tar -xvf DuctApe-latest.tar.gz
cd DuctApe-latest
sudo python setup.py install
Method 4 (missing dependencies will be downloaded)
sudo pip install DuctApe-latest.tar.gz
Method 5 (if you don't have sudo access)
- Extract the archive anywhere (i.e. in your $HOME)
- Add the unzipped directory to your $PATH (i.e. by using the .bashrc file)
tar -xvf DuctApe-latest.tar.gz
export PATH="$HOME/DuctApe-latest/:$PATH";
To check that the install process succeeded, try to open a new terminal and type the following line:
dape --version
DuctApe
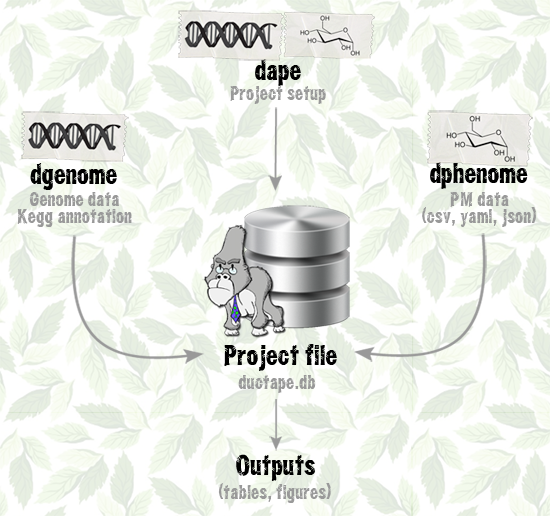
DuctApe consists of three command line utilities with many subcommands: all of them act on a project file (technically speaking an SQLite database) which contains all the informations about the analysis. This file can be exchanged between users and computers without the need to transfer many files, as all the outputs can be generated from this single database. The database file can be even opened with any SQLite browser by expert users for custom queries (the schema definitions can be found here).
The three modules have a somewhat similar subcommands structure: an add command to push input data, a start command to perform the core analysis, an export command to save the outputs for further analysis and a stats command to print out some statistics about the data. Given this common features, each command has a set of unique subcommands and different behaviours and purposes.
All the modules and subcommands have some common options:
- -p
- Project file to be used [default: ductape.db]
- -w
- Working directory [default: .]
- -v
- Increase log verbosity (can be used many times)
- --version
- Print DuctApe version
dape
The main module
dape is the main module of the DuctApe suite, and the first one that should be used when doing an analysis from scratch; it is used to setup the project and to conduct the final metabolic reconstruction.
Project setup
The first step is the project initialization, through the init command.
- -n
- Project name
- -d
- Project description
dape init
There are three projects kind that can be setup with DuctApe: single, mutants and pangenome: for single and pangenome projects, only the add command has to be used, while for the mutants kind, also the add-mut can be used.
- OrgID
- Organism ID [compulsory parameter]
- -n
- Organism name
- -d
- Organism description
- -c
- Organism color
Keep the organism ID length to a maximum of 10 charachters to help graphs readibility.
dape add -n "Sinorhizobium meliloti" -c red Rm1021
- OrgID
- Organism ID [compulsory parameter]
Keep the organism ID length to a maximum of 10 charachters to help graphs readibility.
If you want to set more informations to each organism, use "dape add".
dape add-multi Rm1021 AK83
- MutID
- Mutant ID [compulsory parameter]
- -m
- This mutant wild-type OrgID [compulsory parameter]
- -k
- Mutant kind [insertion|deletion, default: deletion]
- -n
- Organism name
- -d
- Organism description
- -c
- Organism color
dape add-mut -n "Sinorhizobium meliloti mutant" -c blue -m Rm1021 Rm1021-mut
- OrgID
- Organism ID [compulsory parameter]
Some analysis may be redone after the removal of an organism.
dape rm Rm1021
- -o
- Keep organisms data
- -k
- Keep KEGG data
dape clear
Metabolic network reconstruction
This step should be carried on when the other two modules (or just one of them) have already been used; the needed KEGG data is downloaded and the genomic/phenomic maps and graphs can be produced.
- -g
- Skip Kegg mapping
- -y
- Try to fetch Kegg data even while encountering failures
- -s
- Save each pathway graph [default: no]
- -a
- Create single organisms metabolic graphs instead of the whole pangenome
- -t
- Activity threshold for the combined matrix (suggested: half of the maximum value)
The -t option will be used only in mutants and pangenomic projects.
dape start
- OrgID
- Organism ID [optional]
- -a
- Plot the single organisms maps
- -o
- Diff mode: reference organism OrgID
- -d
- Phenomic activity difference threshold
- -s
- Skip the phenomic data
The -a option is used only in pangenomic projects.
dape map
KEGG data import/export
- file
- KEGG data dump file [compulsory parameter]
The KEGG data dump file example can be seen by launching dape export on a complete project.
dape import kegg.tsv
A KEGG data dump file named "kegg.tsv" will be created.
dape export
dgenome
Genome and pangenome analysis
dgenome is the module used to analyze the genomic data, in particular it is used to map the proteins to the KEGG database (through a Blast analysis or parsing a KAAS output) and to calculate the pangenome.
Genome input
- file
- Protein FASTA file [compulsory parameter]
- OrgID
- Organism ID [compulsory parameter]
dgenome add Rm1021.faa Rm1021
If many genomes have to be added to the project, all the FASTA files inside a directory can be imported at once.
- folder
- Fasta files directory [compulsory parameter]
- -e
- FASTA files extension [default: faa]
dgenome add-dir genomes
- OrgID
- Organism ID [compulsory parameter]
Some analysis may be redone after the removal of a genome.
dgenome rm Rm1021
dgenome clear
Genome mapping to KEGG and pangenome construction
The genomes can be mapped to the KEGG database in two ways: locally, through a Blast-BBH analysis against a KEGG database, or by parsing the output of the KAAS annotator. The second option is probably the best, since to obtain a KEGG database dump you need a subscription.
- kofile
- KAAS output file [compulsory parameter]
In the KAAS webpage, select the BBH option and use the appropriate organisms list. When the analysis is finished save the KO list file.
dgenome add-ko Rm1021.tab AK83.tab
The pangenome is calculated through a Blast-BBH, but a custom pangenome can be imported: an example of the pangenome input file can be found here.
- orthfile
- Pangenome file [compulsory parameter]
dgenome add-orth pangenome.tsv
- -n
- Number of CPUs to be used
- -l
- Perform the KEGG mapping locally [default: use KAAS]
- -k
- KEGG Blast database location [only with -l]
- -x
- Orthologous groups prefix
- -m
- BLAST matrix for pangenome [Default: BLOSUM80]
- -e
- BLAST E-value threshold for pangenome [Default: 1e-10]
- -s
- Skip pangenome creation
- -g
- Skip Kegg mapping
- -y
- Try to fetch Kegg data even while encountering failures
With many genomes, the pangenome analysis may need several hours.
dgenome start -n 5
It is possible to transfer the KEGG annotations between orthologs: these annotations will be flagged and saved when using dgenome export.
- -s
- Skip annotation merging (just check)
dgenome annotate
It is possible to revert the annotation transfer at any time.
dgenome deannotate
Data export and statistics
dgenome export
- -s
- Save pictures in svg format, instead of png
dgenome stats
dphenome
Phenome analysis
dphenome is the module used to analyze the phenomic data, in particular it is used to analyze the growth curves and to map the phenomic compounds to KEGG.
Phenome input
The Phenotype microarray output files that are read by DuctApe are csv files (like this one).
From version 0.8.0, DuctApe is able to import the PM data in YAML/JSON format. These files may be generated by other softwares like opm. The curve parameters calculated by other softwares will be mantained: they may be overridden using dphenome start -r
- file
- Phenotype microarray file [compulsory parameter]
- OrgID
- Organism ID [compulsory parameter]
The organism ID should be present in one of the following fields of the csv file: "Strain Name", "Strain Number", "Sample Number".
dphenome add Rm1021.csv Rm1021
Some phenotype microarray files may contain more than one strain: the add-multi subcommand should then be used.
- file
- Phenotype microarray csv file [compulsory parameter]
The organism IDs should be present in the "Strain Name" field of the csv file.
dphenome add-multi Rm1021
If many Phenotype microarray files have to be added to the project, all the csv files inside a directory can be imported at once.
- folder
- Phenotype microarray files directory [compulsory parameter]
dphenome add-dir phenomes
- OrgID
- Organism ID [compulsory parameter]
Some analysis may be redone after the removal of a phenome.
dphenome rm Rm1021
dphenome clear
Not all the PM plates are present inside DuctApe, including putative custom plates; they can be analyzed by importing a tab-delimited file like this one.
- file
- Tab delimited file with custom plate data [compulsory parameter]
dphenome import-plates newtables.tsv
Growth curves analysis and KEGG mapping
Some Phenotype Microarray plates (PM1 to PM8) have a control well, which can be used to subtract the background signal. If a "blank" plate file is available, each well can be subtracted to its blank well.
- -b
- Phenotype microarray blank file
dphenome zero
In some cases the Phenotype Microarray plates may have a different time end point; if this difference is significant it may alter the subsequent calculations. It is wise to trim the PM data to the minimum common time point.
- -t
- Trim time [Default: least common time]
dphenome trim
The growth curves parameters (min, max, height, plateau, slope, lag, area, v, y0) are extracted through a fit to one of the following sigmoid functions: logistic, gompertz and richards; some of the extracted parameters (max, area, height, lag, slope) are used to perform a k-means clustering on all the growth curves, thus obtaining the so-called Activity Index (AV), which with the dafault settings goes from 0 (no activity) to 9 (max activity). Using the -n option the user can decide the number of clusters and therefore the highest value for the AV. The optimal number of clusters may be decided by using the -e option.
- -f
- Save some intermediate pictures of the clustering process
- -s
- Skip parameters calculation
- -g
- Skip Kegg mapping
- -y
- Try to fetch Kegg data even while encountering failures
- -r
- Force parameters recalculation
- -n
- Number of clusters to be used for AV calculation [Default: 10]
- -e
- Perform an elbow test to choose the best "n" parameter
dphenome start
Replica management
DuctApe is able to remove the inconsistent replica from the phenomic experiment, following five distinct policies:
- replica
- Remove a specific replica (the replica ID must be provided)
- keep-max
- Keep the highest AV values
- keep-min
- Keep the lowest AV values
- keep-max-one
- Keep only the highest AV value
- keep-min-one
- Keep only the lowest AV value
- policy
- Policy to be applied [compulsory parameter]
- plateID
- Plate(s) to be purged [default: all plates]
- -d
- Maximum AV delta before applying the purging policy [default: 3]
dphenome purge -d 4 keep-max
dphenome purge replica 2
- plateID
- Plate(s) to be restored [default: all plates]
dphenome restore
Plotting, data export and statistics
- -n
- Experiment name
- -s
- Save pictures in svg format, instead of png
- PLATE
- Single plate to be plotted (optional)
- WELL
- Single well to be plotted
dphenome plot
dphenome plot PM01
dphenome plot PM01 A01
- -d
- Activity Index delta threshold [default: 3] (doesn't apply when option -r is used)
- -o
- Diff mode: reference OrgID to which compare the other organisms
- -r
- Single parameter mode: use a single curve parameter instead of activity
- -s
- Save pictures in svg format, instead of png
dphenome rings -d 4
From version 0.8.0, DuctApe is able to export the PM data in YAML/JSON format. These files can be loaded by other softwares like opm
- -j
- Export PM data in JSON format instead of YAML
dphenome export
- -a
- Activity Index threshold [default: 5]
- -d
- Activity Index delta [default: 3]
- -s
- Save pictures in svg format, instead of png
dphenome stats
Examples
Annotated sample scripts
Single organism
# Initialize the project
dape init
# add my organism using the ID MyOrg
dape add MyOrg

# add the proteome of MyOrg
dgenome add MyOrg.faa MyOrg
# adds the output of KAAS, a KEGG mapper
dgenome add-ko MyOrg.tab
# map the proteome to KEGG
dgenome start
# statistics and graphics
dgenome stats
# export the genomic data
dgenome export

# add the phenomic experiment, Phenotype microarray data
dphenome add MyOrg.csv MyOrg
# perform control subtraction
dphenome zero
# calculate the growth parameters and perform the clusterization, using 4 CPUs
dphenome start
# plot the growth curves
dphenome plot
# remove inconsistent replicas: keep the highest replicas when there is an activity index delta >= 3
dphenome purge -d 3 keep-max
# plot only those curves that are not purged
dphenome plot
# plot the phenomic ring
dphenome rings
# restore the purged replicas
dphenome restore
dphenome stats
dphenome export

# output KEGG metabolic maps with genomic/phenomic data
dape map
# perform the metabolic network analysis
dape start
# export the KEGG data
dape export
Mutants
dape init
# Import the previous KEGG database dump
dape import kegg.tsv
dape add MyOrg
# add mutant MyMut, a deletion mutant of MyOrg
dape add-mut -m MyOrg -k deletion MyMut

# add the proteins files found in this directory
dgenome add-dir MyFolder
dgenome add-ko MyOrg.tab
dgenome start
# add the phenomic files found in this directory
dphenome add-dir MyPhenomicFolder
dphenome zero
dphenome start
dphenome purge -d 3 keep-max
dphenome plot
dphenome rings

# plot only the maps of the mutant
dape map MyMut
# Perform the network analysis
dape start
PanGenome
dape init
dape add MyOrg
dape add MyOrg2
dape add MyOrg3

dgenome add-dir MyFolder
dgenome add-ko MyOrg.tab MyOrg2.tab MyOrg3.tab
# also perform pangenome creation using 4 CPUs
dgenome start -n 4
# Export and plot statistics
dgenome export
dgenome stats

dphenome add-dir MyPhenomicFolder
dphenome zero
dphenome start
dphenome purge -d 3 keep-max
dphenome plot
# rings with diff mode: compare the activity of MyOrg
dphenome rings -o MyOrg

dape start
Test
You can test the program using the test suite provided
- Enter the directory
- Launch the tests (it takes some hours)
cd test
bash test.sh
Talks
Presentations about DuctApe
- 2013/03 - Conference on predicting cell metabolism and phenotype [pdf]